Table Comparison Toolkit
![]()
The artifact-core table comparison toolkit offers a comprehensive suite of artifacts for the evaluation of tabular data synthesis experiments.
Usage Sketch
import pandas as pd
from artifact_core.table_comparison import (
TableComparisonEngine,
TableComparisonScoreCollectionType,
TabularDataSpec
)
df_real = pd.read_csv("real_data.csv")
df_synthetic = pd.read_csv("synthetic_data.csv")
data_spec = TabularDataSpec.from_df(
df=df_real,
cat_features=categorical_features,
cont_features=continuous_features
)
engine = TableComparisonEngine(resource_spec=data_spec)
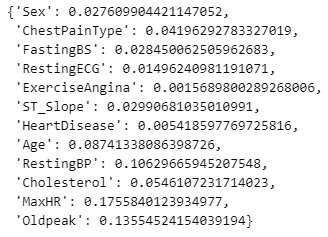
dict_js_distance_per_feature = engine.produce_dataset_comparison_score_collection(
score_collection_type=TableComparisonScoreCollectionType.JS_DISTANCE,
dataset_real=df_real,
dataset_synthetic=df_synthetic,
)
dict_js_distance_per_feature
from artifact_core.table_comparison import (
TableComparisonPlotType,
)
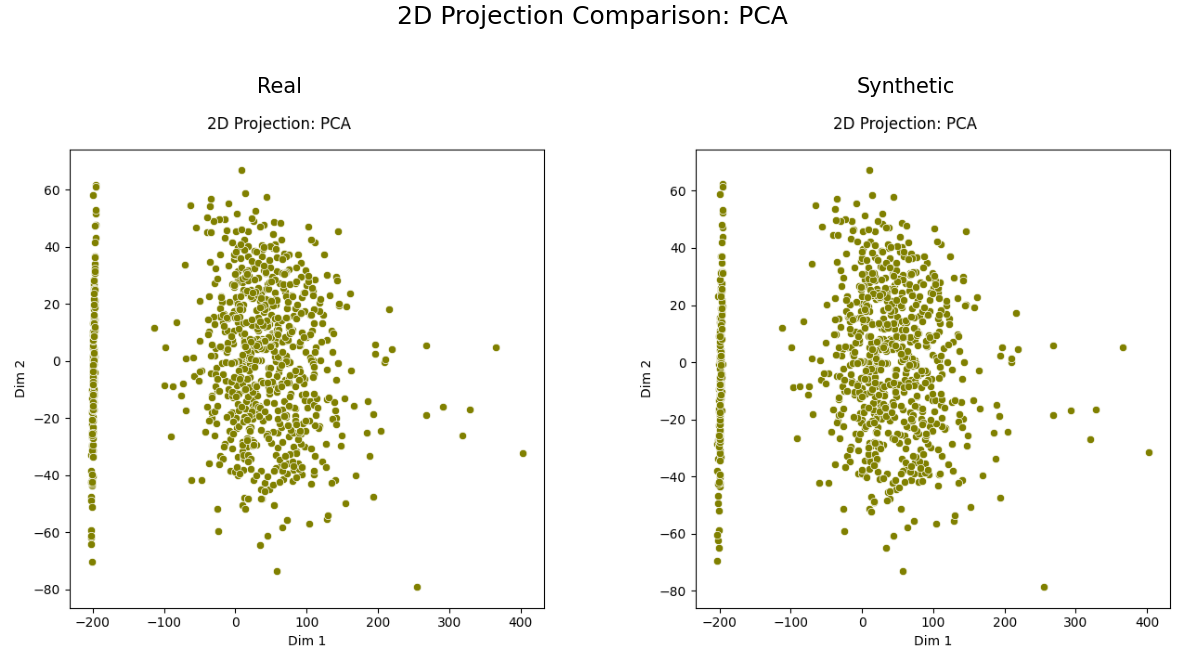
pca_plot = engine.produce_dataset_comparison_plot(
plot_type=TableComparisonPlotType.PCA_JUXTAPOSITION,
dataset_real=df_real,
dataset_synthetic=df_synthetic,
)
pca_plot
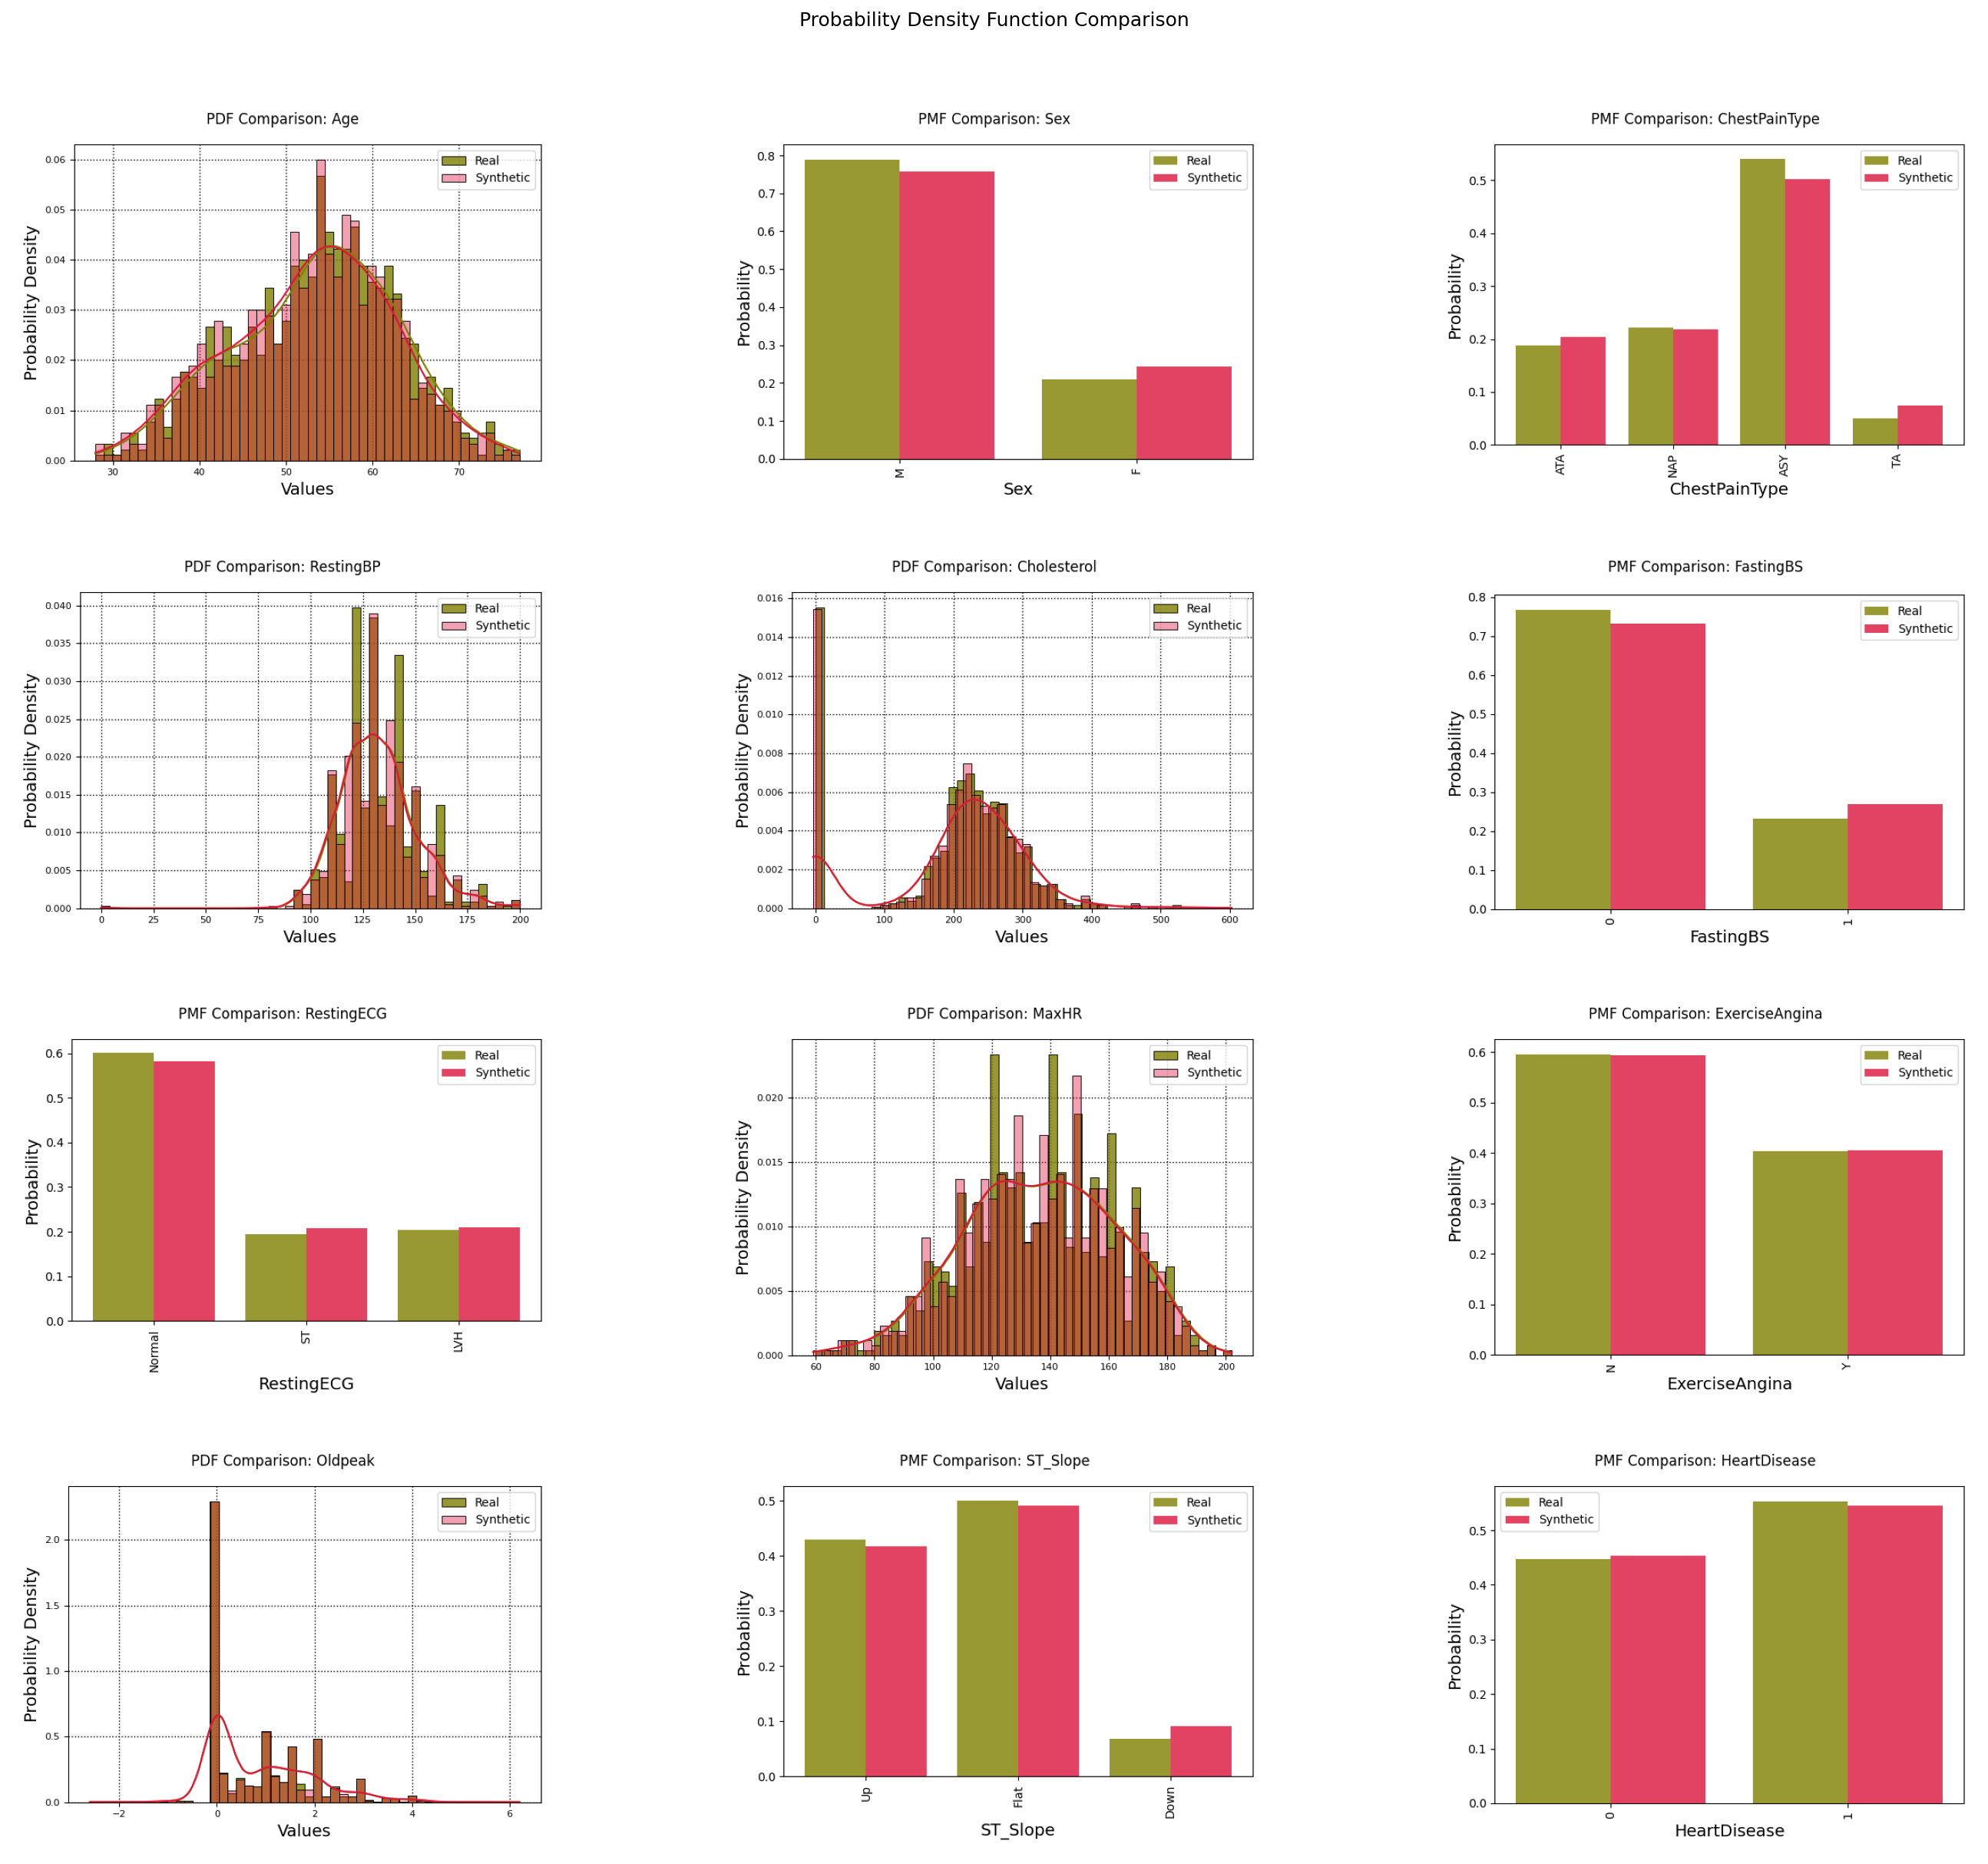
pdf_plot = engine.produce_dataset_comparison_plot(
    plot_type=TableComparisonPlotType.PDF,
    dataset_real=df_real,
    dataset_synthetic=df_synthetic,
)

pdf_plot
Supported Artifacts
Scores
MEAN_JS_DISTANCE: Average Jensen-Shannon divergence over all features.CORRELATION_DISTANCE: Distance between correlation matrices.
Plots
PDF: Overlaid probability density (or mass) plots for real and synthetic data.CDF: Overlaid cumulative distribution plots for real and synthetic data.DESCRIPTIVE_STATS_ALIGNMENT: Alignment of descriptive statistics between real and synthetic data.MEAN_ALIGNMENT: Alignment of means between real and synthetic data.STD_ALIGNMENT: Alignment of standard deviations between real and synthetic data.VARIANCE_ALIGNMENT: Alignment of variances between real and synthetic data.MEDIAN_ALIGNMENT: Alignment of medians between real and synthetic data.FIRST_QUARTILE_ALIGNMENT: Alignment of first quartiles between real and synthetic data.THIRD_QUARTILE_ALIGNMENT: Alignment of third quartiles between real and synthetic data.MIN_ALIGNMENT: Alignment of minimum values between real and synthetic data.MAX_ALIGNMENT: Alignment of maximum values between real and synthetic data.CORRELATION_HEATMAPS_JUXTAPOSITION: Juxtaposed correlation matrix heatmaps for real and synthetic data.PCA_JUXTAPOSITION: Visual PCA projection comparison between real and synthetic data.TRUNCATED_SVD_JUXTAPOSITION: Visual truncated SVD projection comparison between real and synthetic data.TSNE_JUXTAPOSITION: Visual t-SNE projection comparison between real and synthetic data.
Score Collections
JS_DISTANCE: Collection of Jensen-Shannon distances for all features.
Array Collections
MEAN_JUXTAPOSITION: Juxtaposition of real and synthetic mean values for all continuous features.STD_JUXTAPOSITION: Juxtaposition of real and synthetic standard deviations for all continuous features.VARIANCE_JUXTAPOSITION: Juxtaposition of real and synthetic variances for all continuous features.MEDIAN_JUXTAPOSITION: Juxtaposition of real and synthetic median values for all continuous features.FIRST_QUARTILE_JUXTAPOSITION: Juxtaposition of real and synthetic first quartile values for all continuous features.THIRD_QUARTILE_JUXTAPOSITION: Juxtaposition of real and synthetic third quartile values for all continuous features.MIN_JUXTAPOSITION: Juxtaposition of real and synthetic minimum values for all continuous features.MAX_JUXTAPOSITION: Juxtaposition of real and synthetic maximum values for all continuous features.
Plot Collections
PDF: Collection of overlaid (real & synthetic) PDF plots for all features.CDF: Collection of overlaid (real & synthetic) CDF plots for all features.CORRELATION_HEATMAPS: Correlation matrix heatmaps for real and synthetic data.